
The REALSystem
REAL y-Series® is a virtual reality (VR) rehabilitation tool for Physical and Occupational Therapists. It also empowers patients with engaging therapeutic activities that focus on motor skills, core, balance, cognition, functional tasks, and activities of daily living (ADL) .
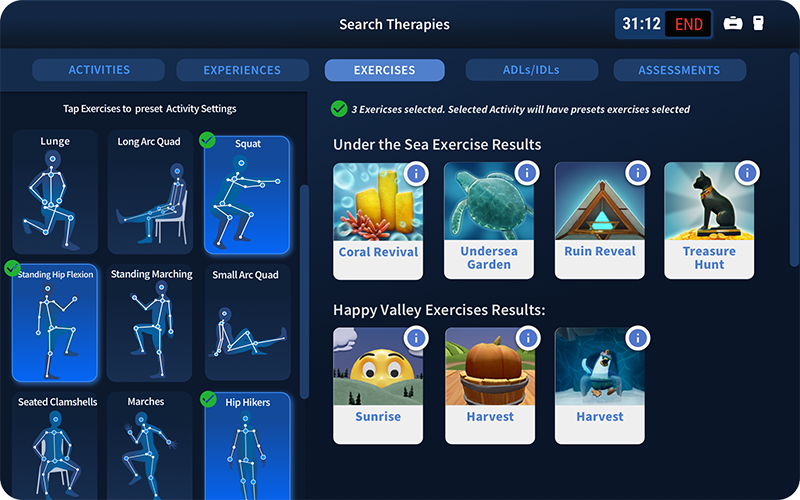
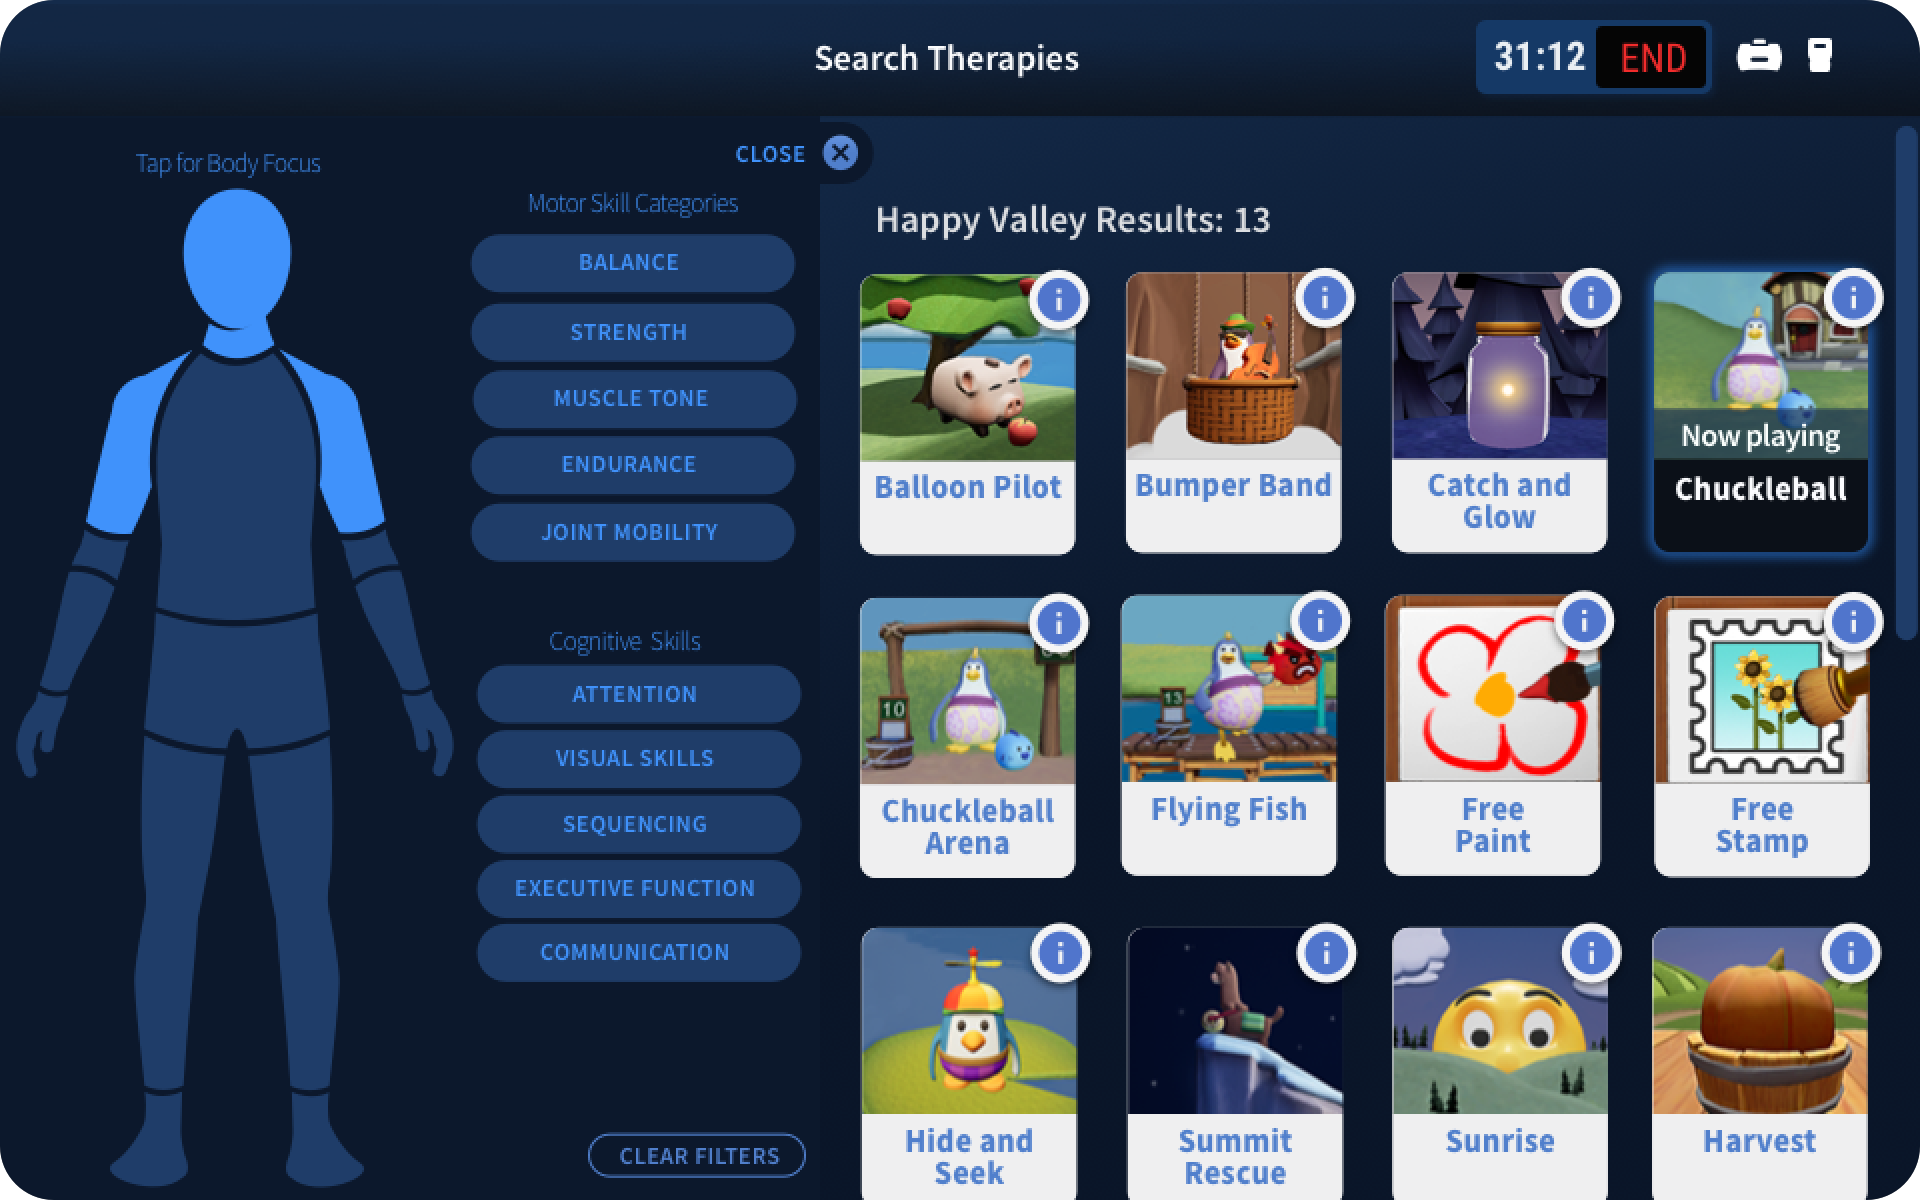
In 2020, REALSystems had a very crude web application prototype as a controller for activity settings. Using the same REACT library, I created an entirely new hierarchy,UI and filtering UX for therapists to select and manage therapy activities in the clinic. The result was less time spent setting up therapy and increased time and efficacy of treatment. The tablet experience, named TherapyView®, allows clinicians to view streaming video of the patient’s viewpoint and adjust settings on the fly with minimal disruption. Instead of stock Android Material UI(purposed for direct interaction with phones and tablets) I created an entirely new set of components that addressed the arms-reach, “5ft display” needs of a clinician who is physically assisting patients. Highlights:
Created Sketch library components with new buttons,controls,dialogs,feed-back states, and onboarding UI,
Streamlined UI and simplified heuristics
Improved visual design with higher contrast controls and consistency
Decreased clutter and improved screen real estate for immediate needs
Rearchitected real-time spectator view controls
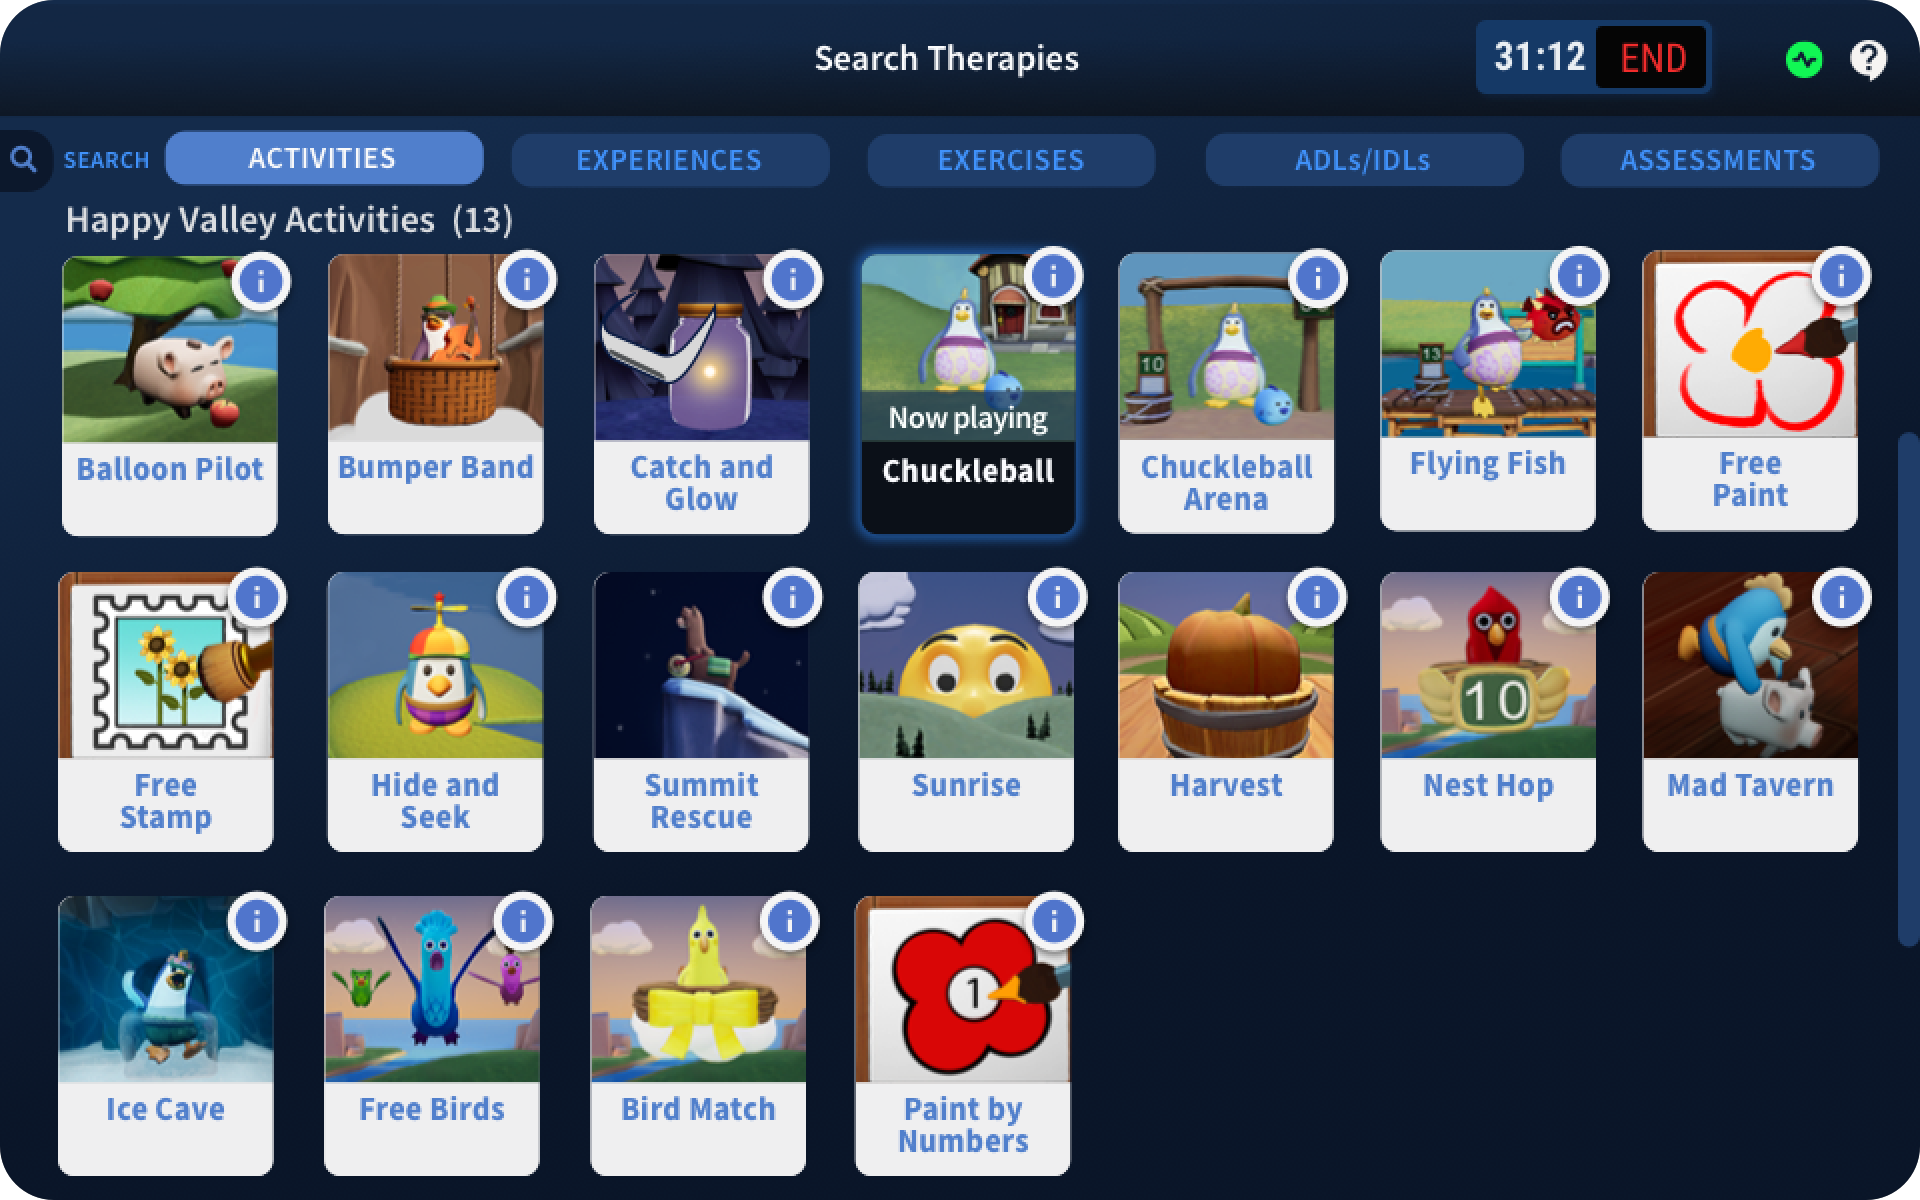
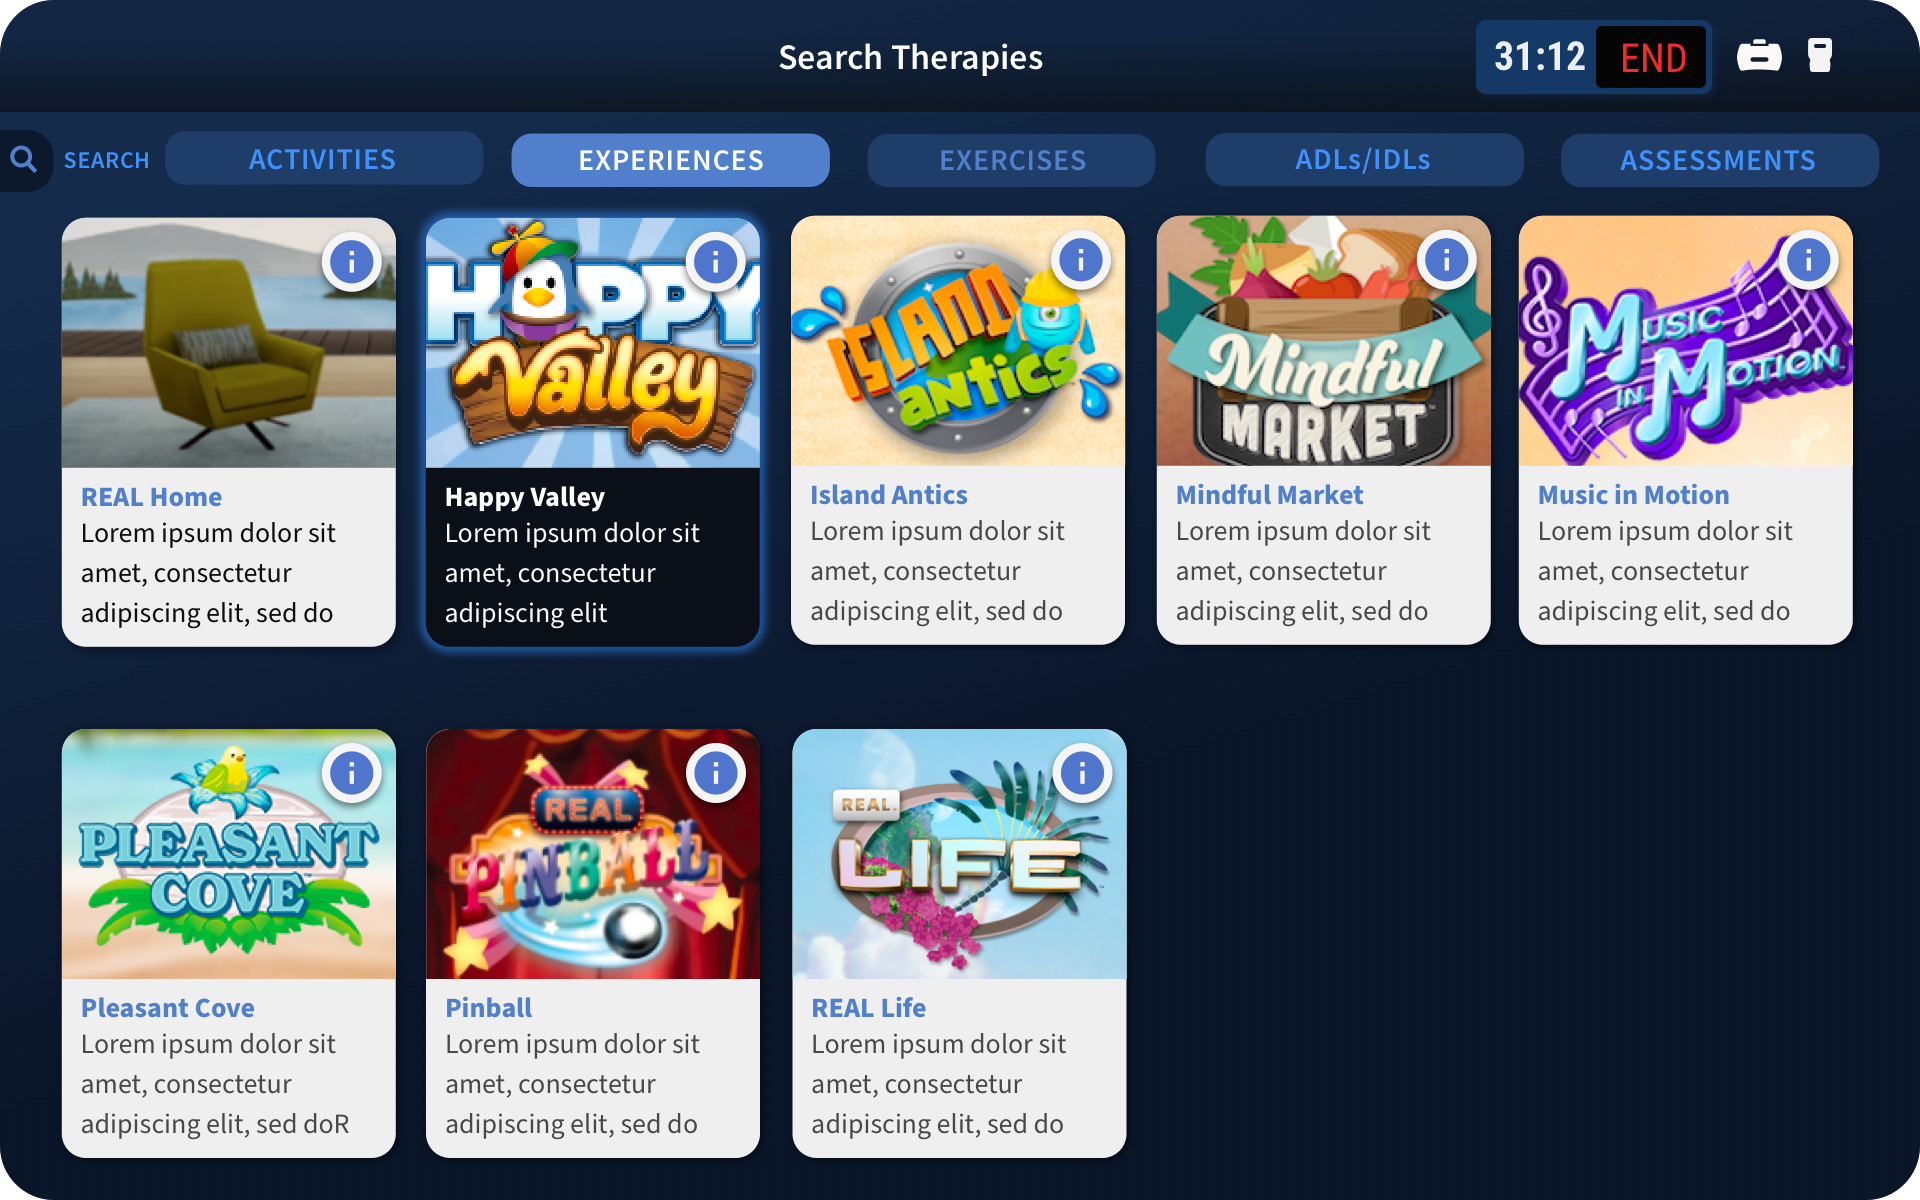
Created filtered search UI/UX to speed up activity selection
Converted to FIGMA and created new prototypes for t-series “at home” experience

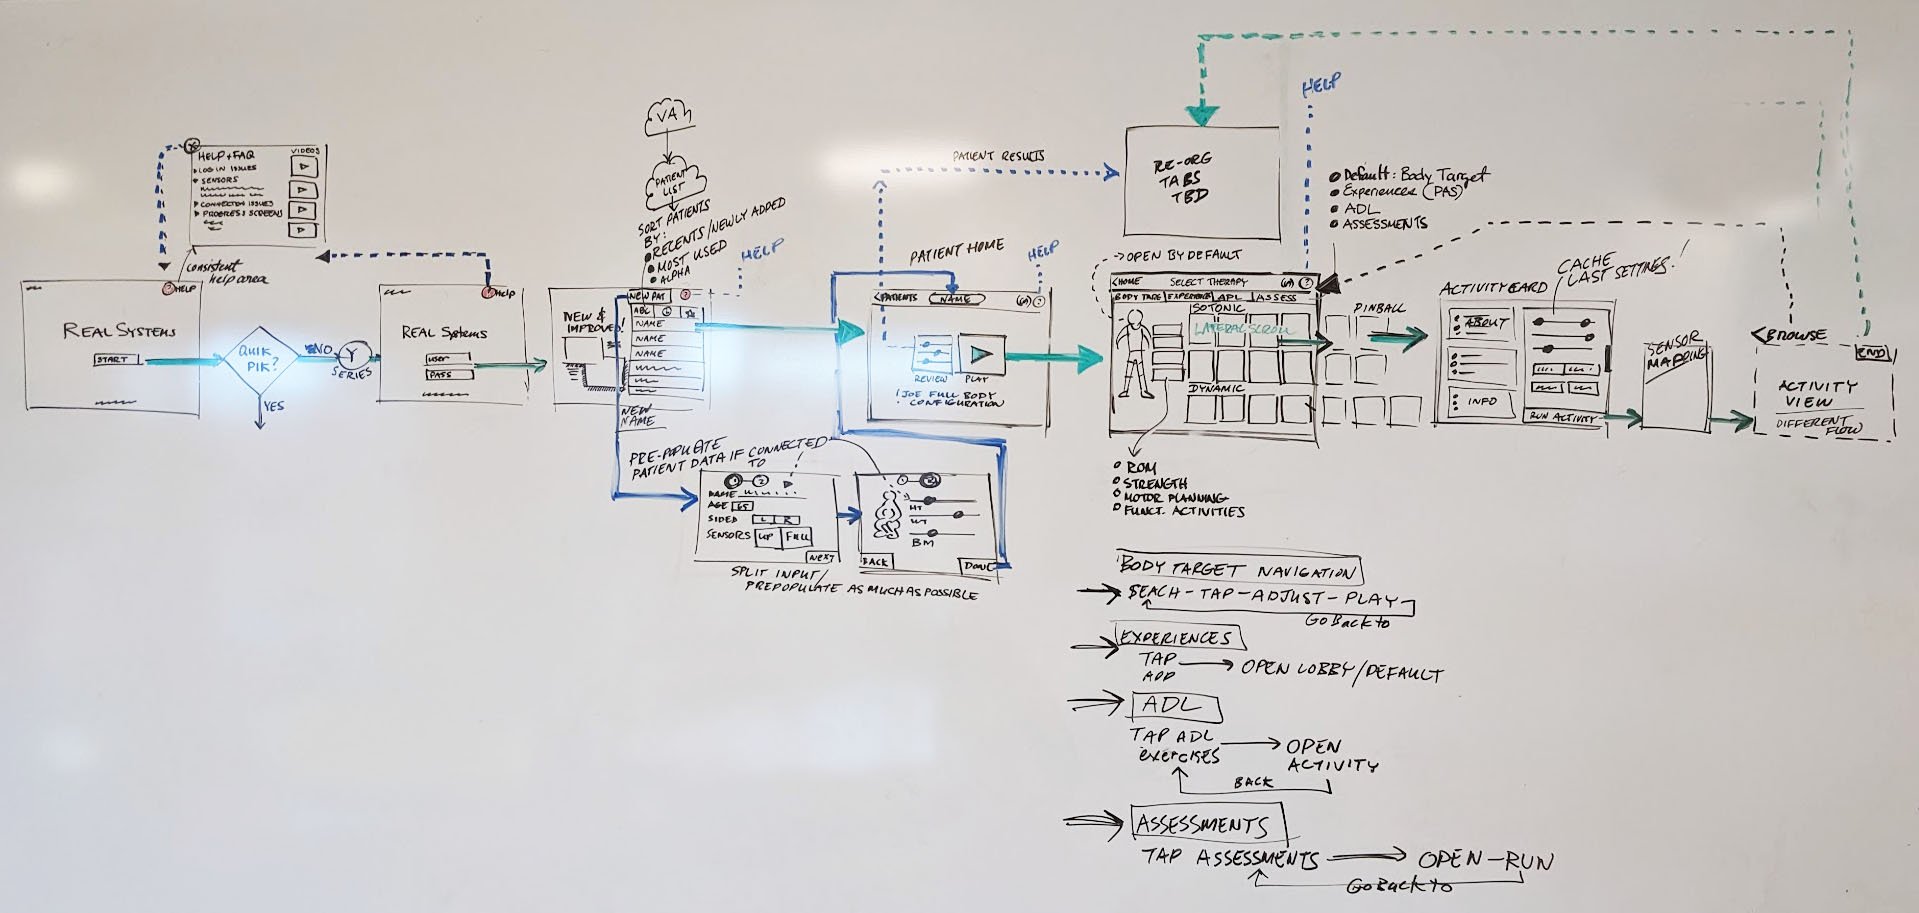
The vintage whiteboard: My preferred process(due to my fast drawing ability) is to create a “live” UX flow with major stakeholders including product, engineering and QA. The REAL offices often have these creative sessions up for years with the “DO NOT ERASE” comment on them. Often referenced and used for building use cases, preliminary engineering code and testing. The benefit of this loose style is that engineering considers it non-threatening and an open door policy.
TherapyView
Using filtering 2.0, therapists can find activities that address standardized movements and exercises such as lunges, squats, knee flexion and more
The user can address specific body zones and impairments to create a session playlist. Each activity required extensive metadata input and tagging to get the most accurate results.
Previous versions of TherapyView had poor feedback and game controls. The revised UX supplied clinicians with full-screen review and large onscreen controls for users that cannot hold the tablet and physically guard the patient
Ironically, engineering had placed help and videos behind the password protected log in screen. We added videos from marketing and network diagnostics for QA and customer support to reduce time servicing calls.
Version 1 of the y-Series used an older model TP Link router complete with a diagnostic set up tool. The UX was extremely poor and hard to understand. I led the efforts to remove the router and designed a streamlined experience for users to set up their tablet and headset connection to the cloud.
Simplified screen so that clinicians can set up a realistic patient avatar and review a real-time body mass throttle results. The more realistic the avatar-the more accurate the results as sensors have to compensate for density, height and body shape.
Individual activities used to be hidden in their "experience" folders and it was difficult for clinicians to hunt down and find their favorites. We tagged and modified the metadata to support this more granular breakdown.
Experiences are thematic groupings of individual activities by developer or "vibe." Certain patients respond to different artistic themes and its easier for clinicians to find a suitable set of activities.
As REAL expanded their library of activities, it was becoming more difficult to discover what would be relevant to a patient. I created a UI that could programmatically extract the tags and metadata and show the impairments that could be addressed.
Previous designs had a mash up of patient progress and session initiation on one screen. Therapists had a difficult time finding the "start" button. We created a modular screen that support multiple gateways such as:
-New Session
-Measurements and Progress Screens
-Future affordances such as assessments
In 2023, REAL set out to create a suite of standard assessments for clinicians who needed to submit assessment data to insurance providers to prove efficacy. VR assessments were easily measurable but also could expand data to use sensor feedback like jitter, twisting and stumbling.
The addition of a results screen for assessments helps clinicians gauge the quality of the assessment and where the difficulties may reside. This could be balance or sidedness compensations. These results are recorded to the cloud for future reference and billing accuracy.
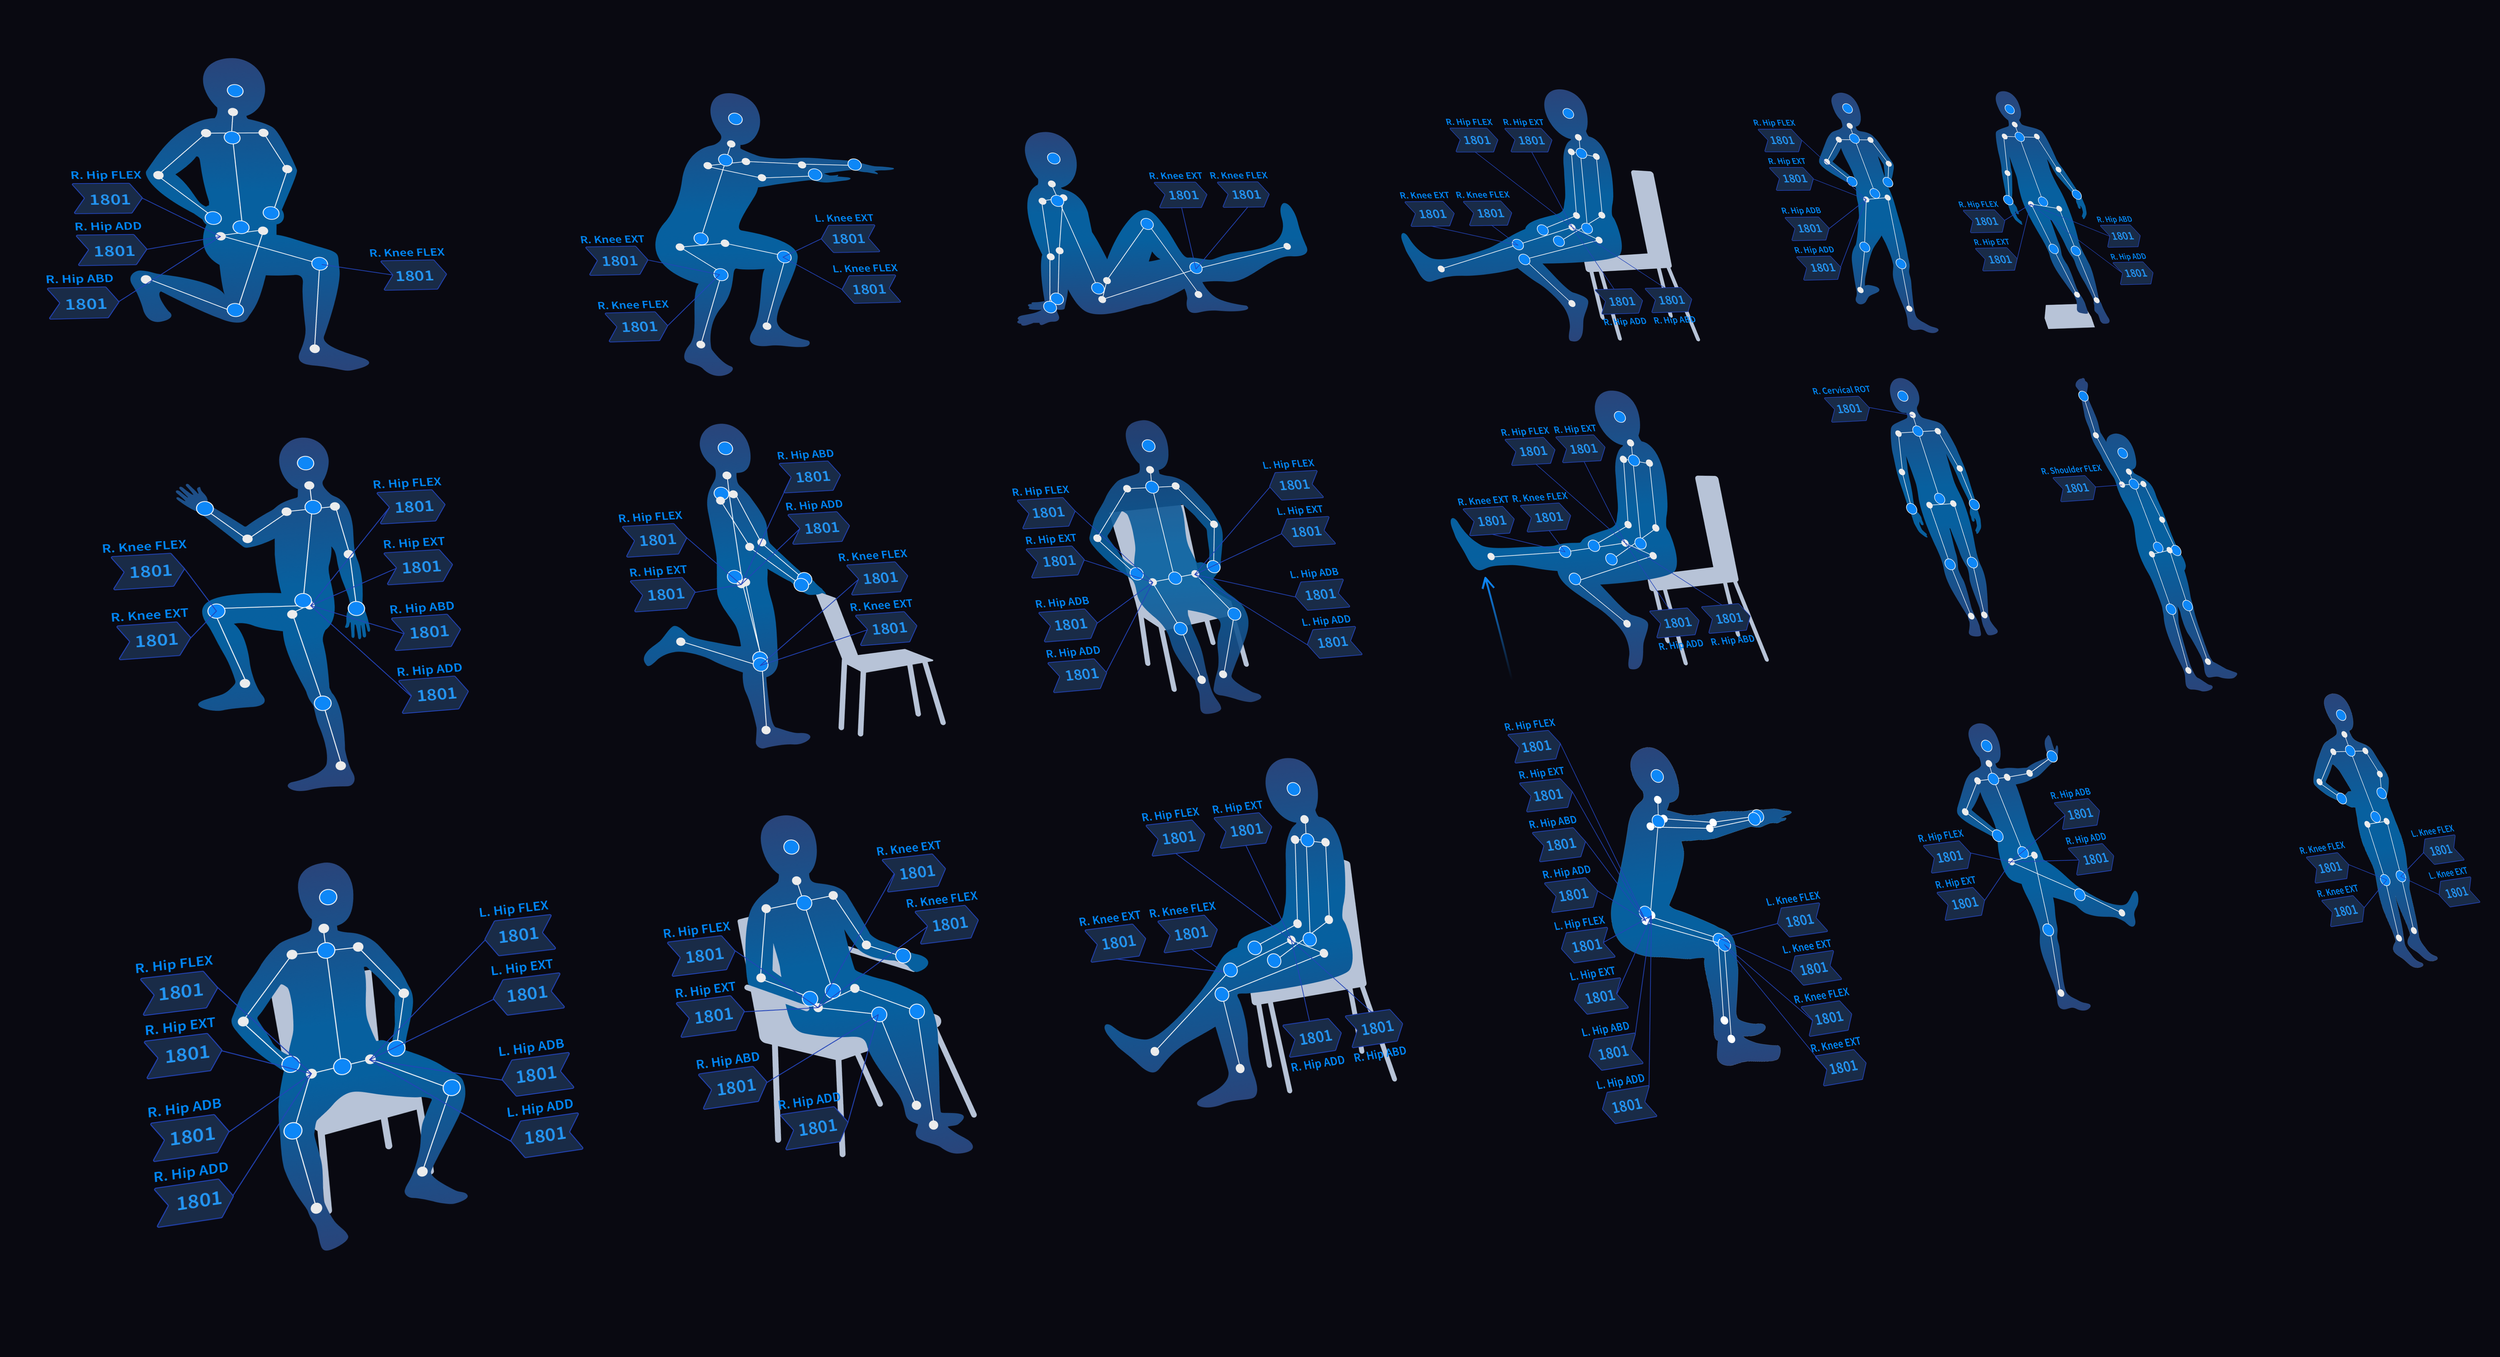
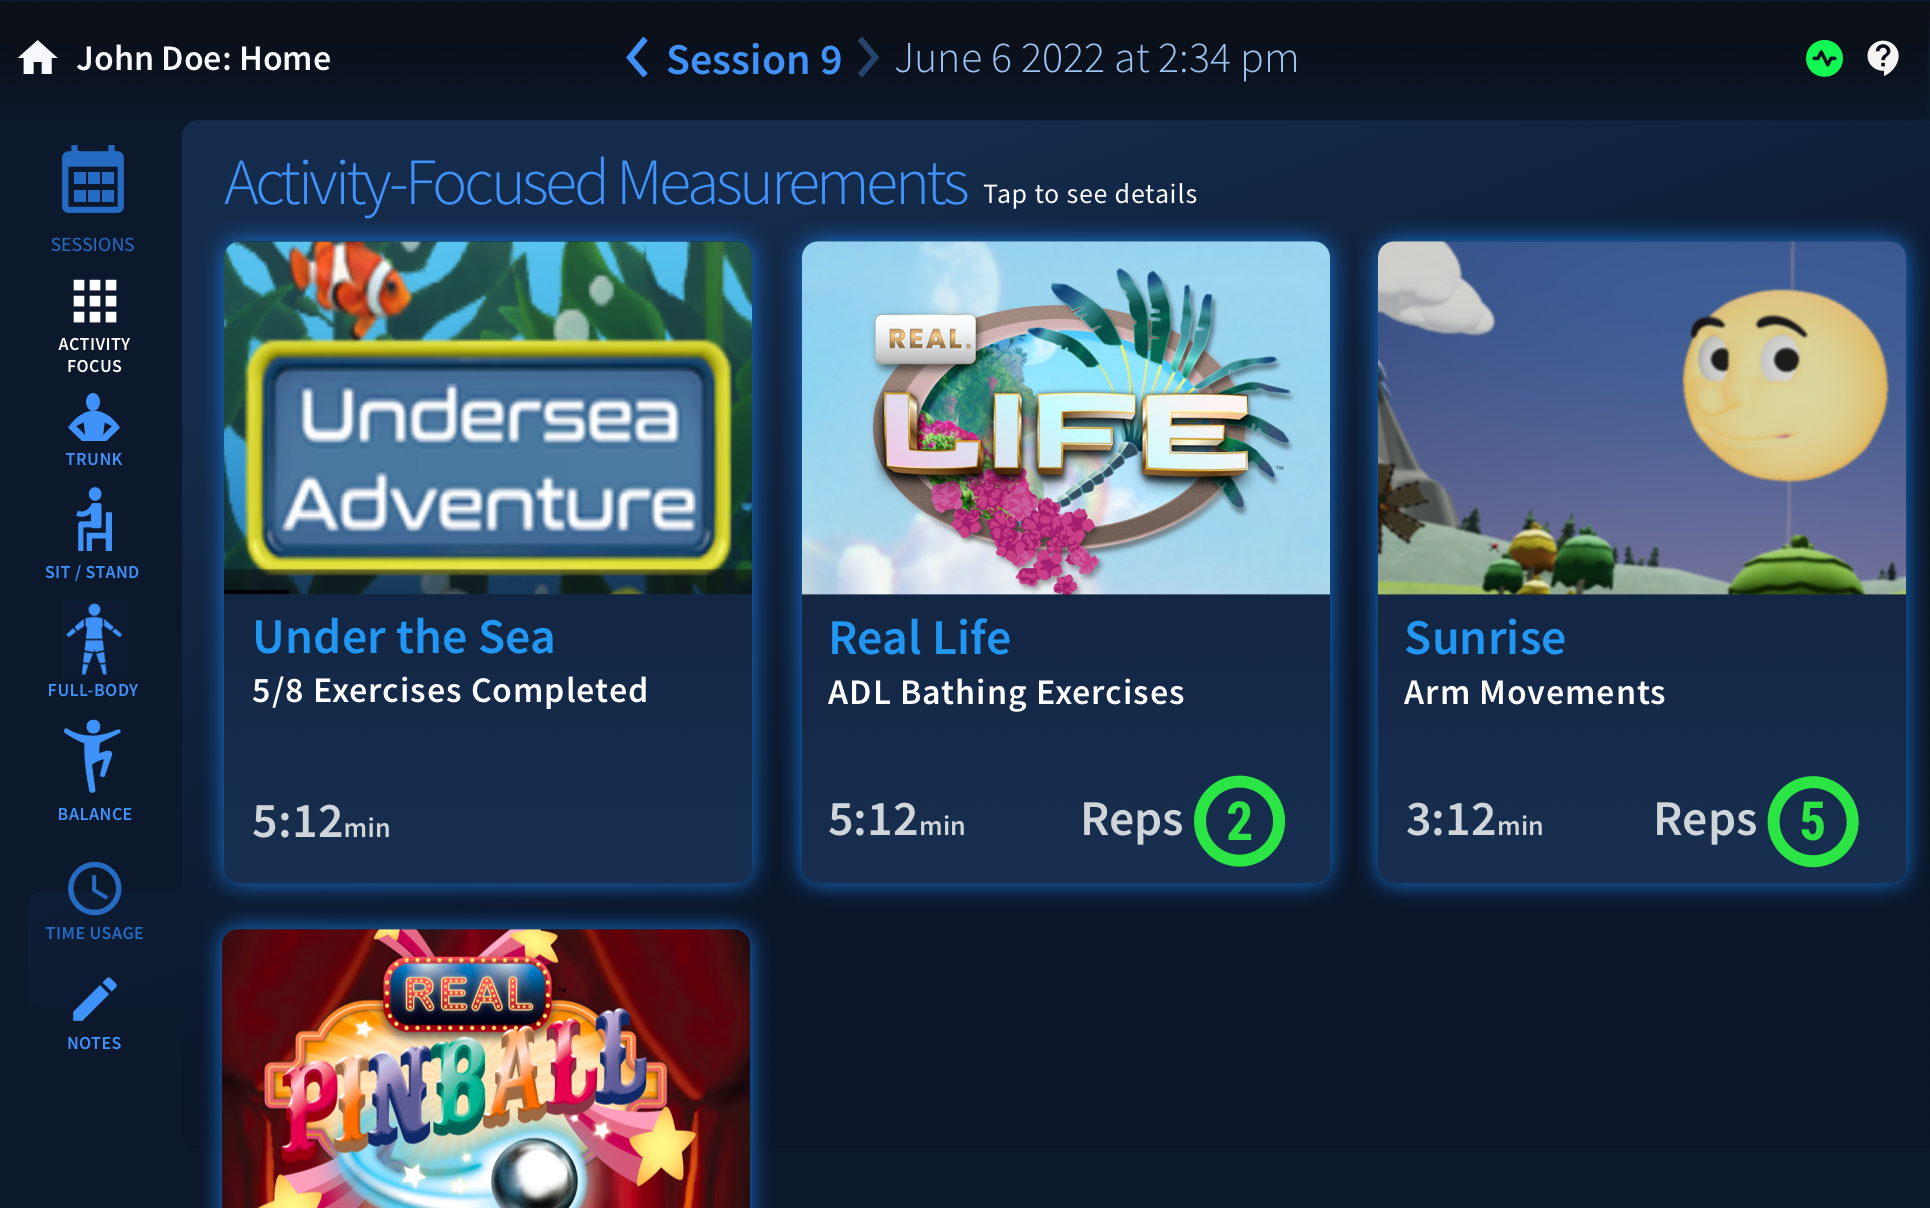
Patient Progress and Measurements
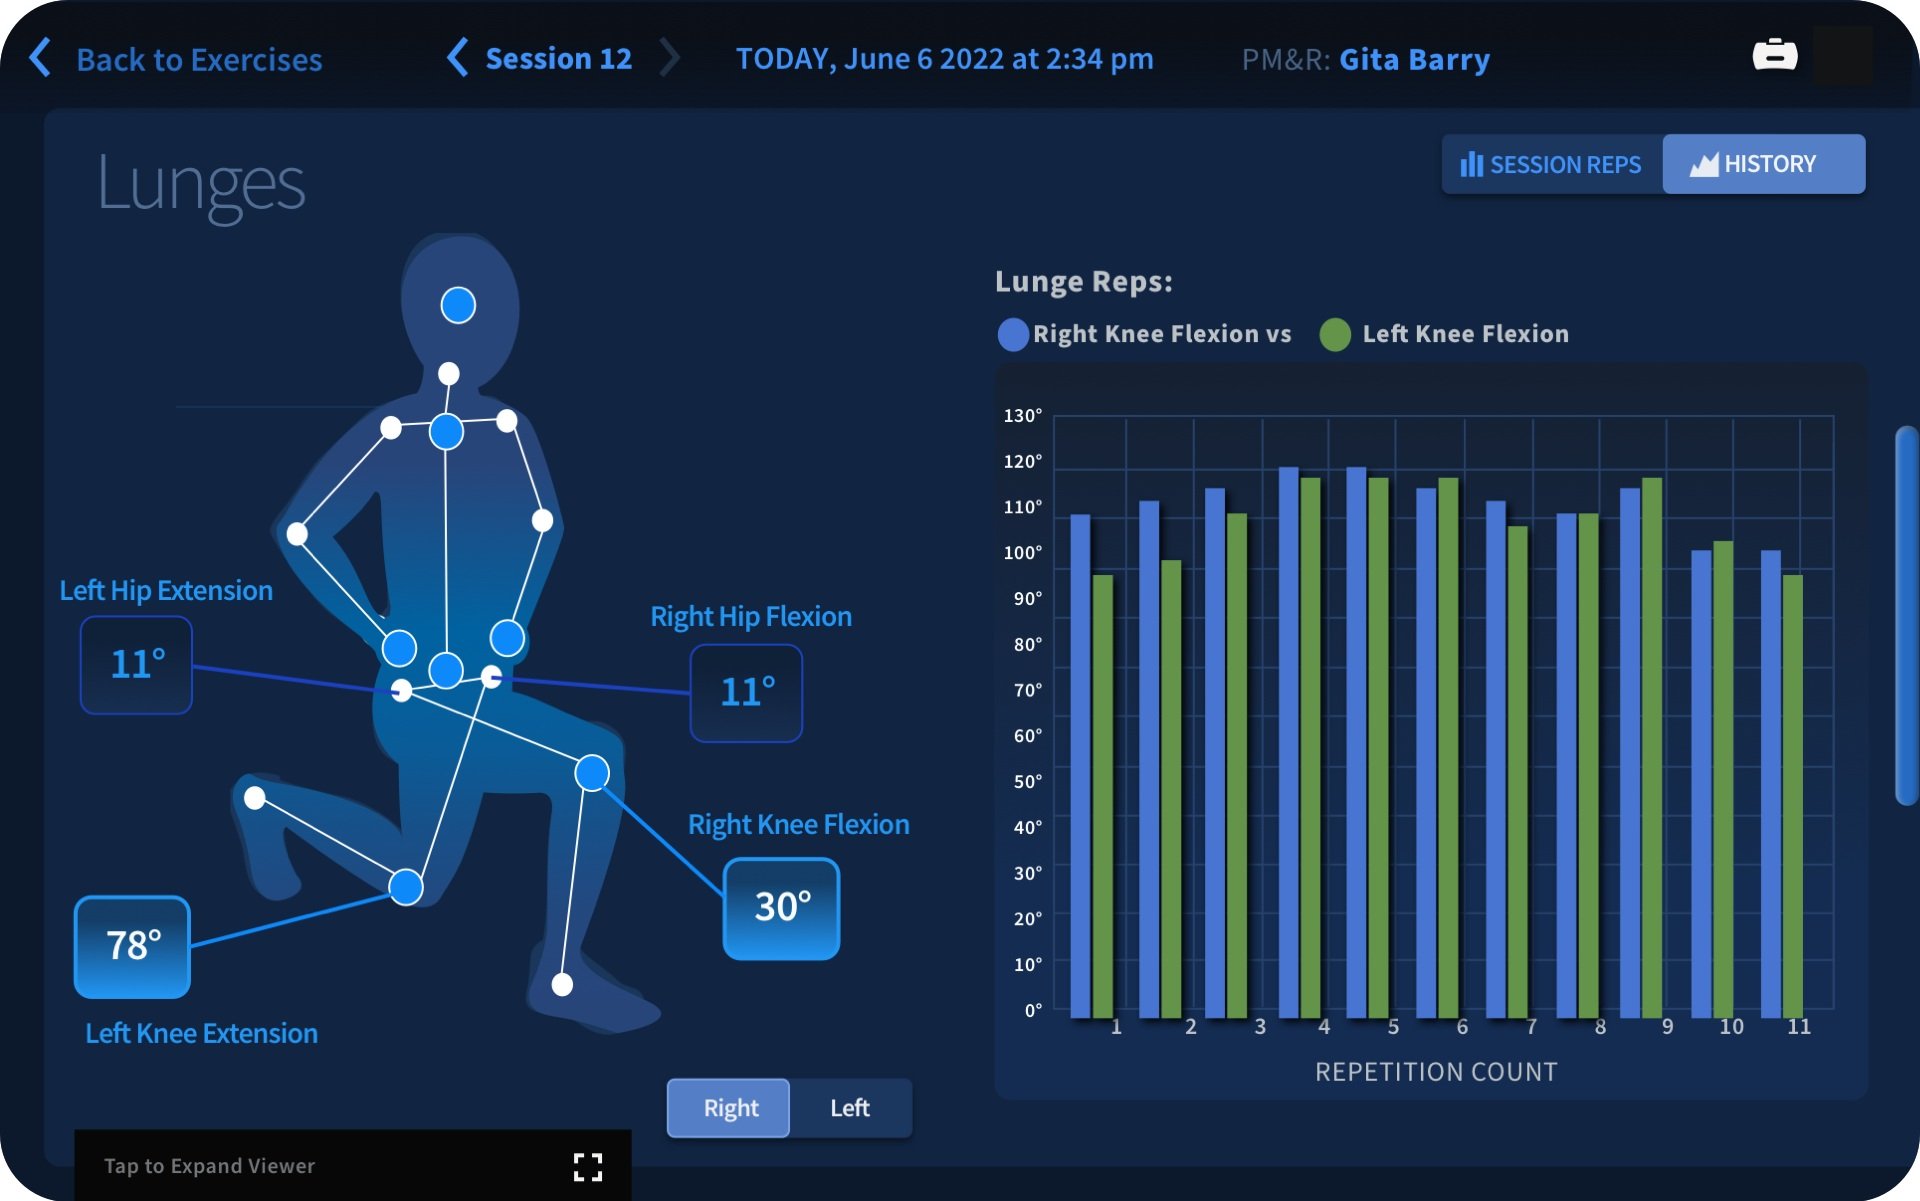
In 2022 we expanded TherapyView® to include an entirely new array of sensor data measurements. Previous data was limited to a numeric grid of mobility standards of ROM. I created a modular system which could be expanded each release for new metric types. All measurement types could be expanded to show longitudinal data over session history, such as knee flexion or a specific exercise.
Activities will have game-specific results which previously had not been tracked (scores as example). This screen reflects a session's playlist and any specific results data.
Instead of generalized game metrics, for specific movements and exercises the therapist is able to select an exercise and review results across all activities that contain that exercise.
Individual exercises will have a variety of muscle group measurements. Primary and secondary ROM values can show a clinician if the patient is using compensatory muscles or movements to hide impairments. Each image is a programmed SVG with dynamic data inputs from the REAL Cloud.
Increases in ROM and mobility can be displayed on any session value link. Proving efficacy over time is important to clinics to prove value of therapy and access to continued billing.
Anterior and posterior lean data is a primary source of patient improvement data. Sensors coordinate with the headset and upload raw data to REAL Cloud Services. Using customized eCharts we can display the improvements in maximum lean control forward and sideways when in game play.
In 2022 REAL added full-body, standing ability to their sensor configurations. This enables more endurance-based activities to be converted to a standing position. Part of rehab progress is a patients endurance which can be measured(as a proxy) with sitting vs. standing ratio. Tracking this over time or over the session can display fatigue points.
These charts show thoracic and lumbar improvements over a period of time. Again, this assists clinicians in proving efficacy of therapy and proving to insurance that therapy has billing value for the patient.
Showing bias over the direct center of mass plus lean max angles. Heatmapping can show tendencies and areas of neglect which the therapist can focus on using difficulty settings.
Areas of neglect or weaknesses can be measured in absolute degrees using sensor data which is packaged and sent to the REAL Cloud Services by the Vive Headset.
Longitudinal data shows session duration over time(endurance measurement), sit and stand ratio, sensor configurations in the session. Relative time spent in impairment focused categories also is a valued metric-therapists may need to adjust for the future sessions.
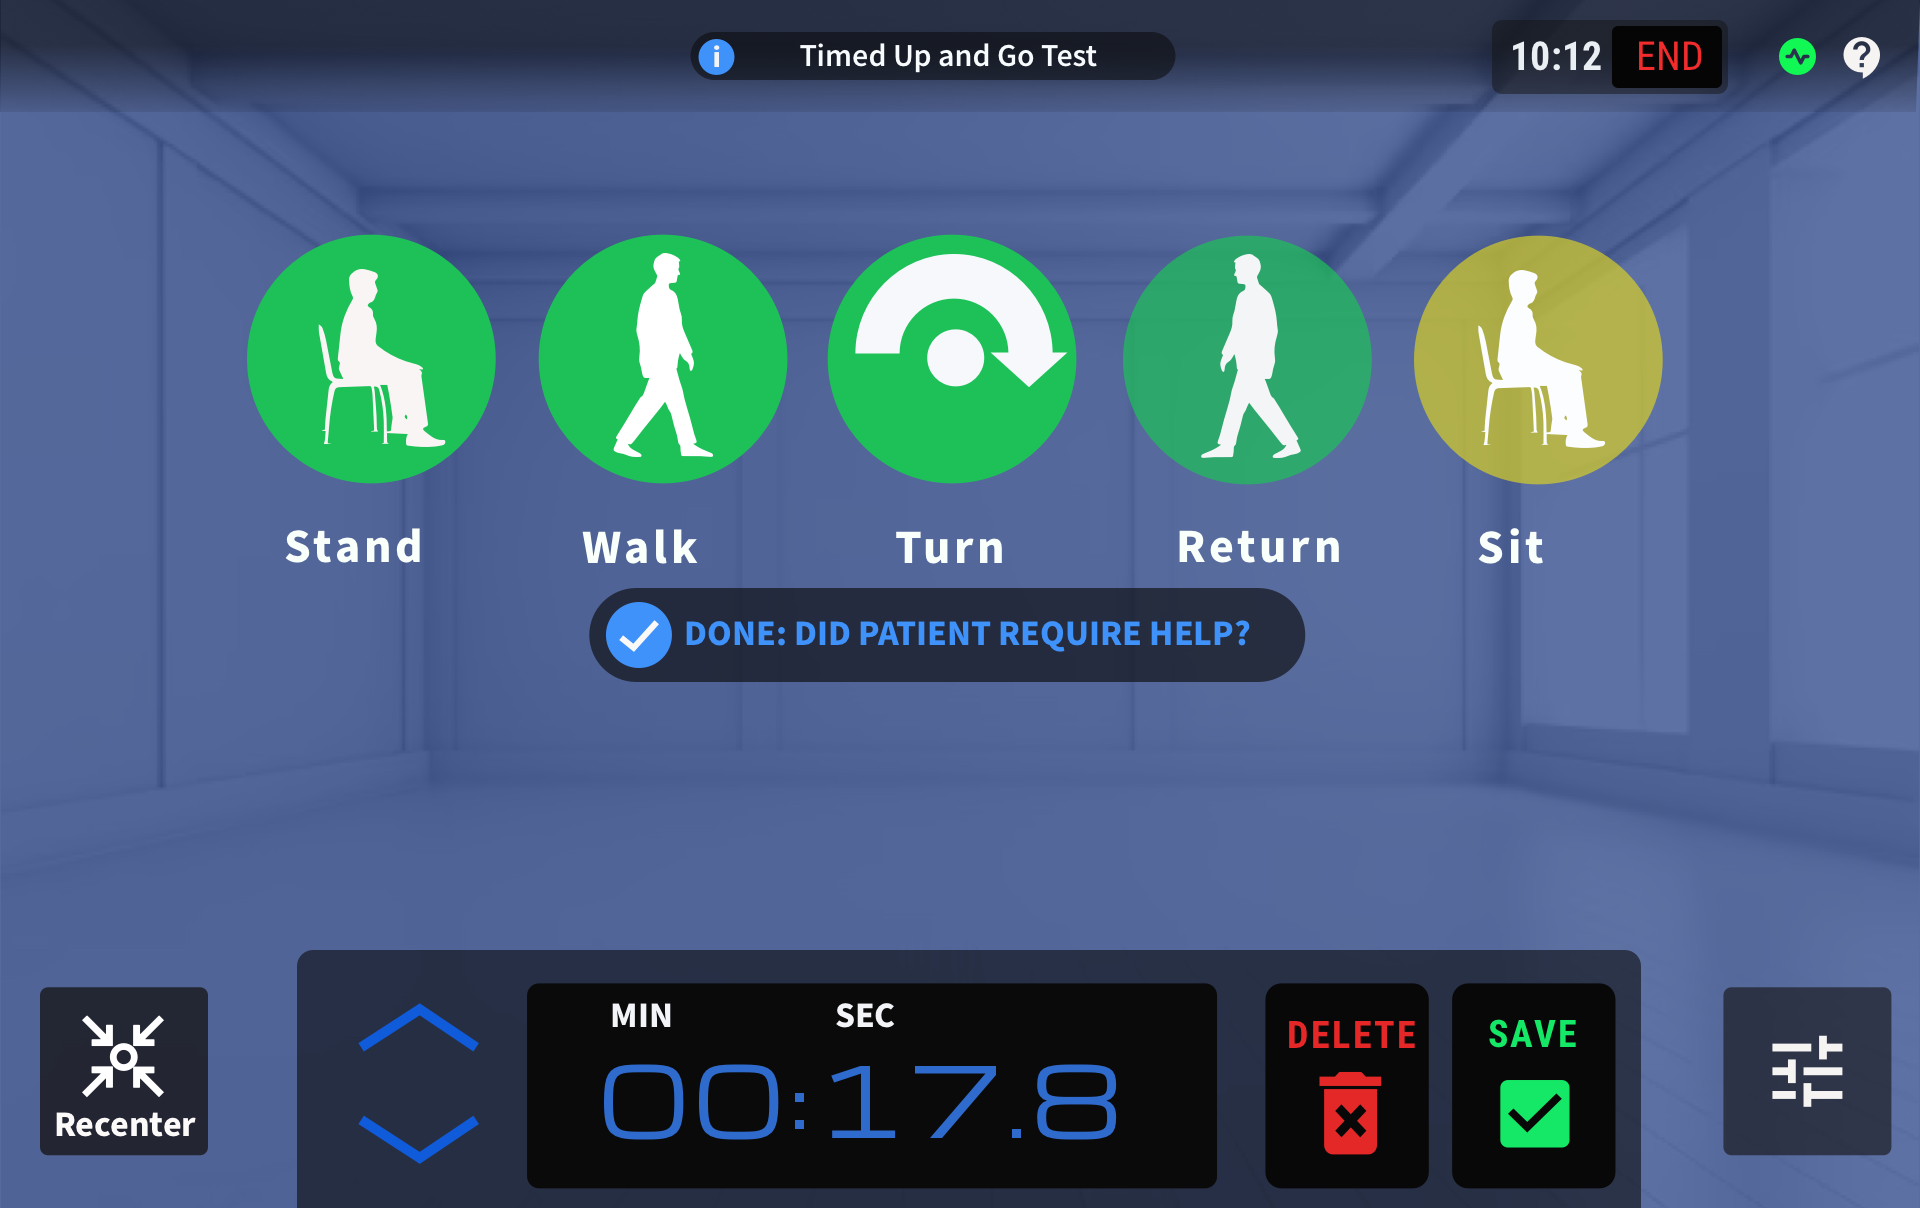
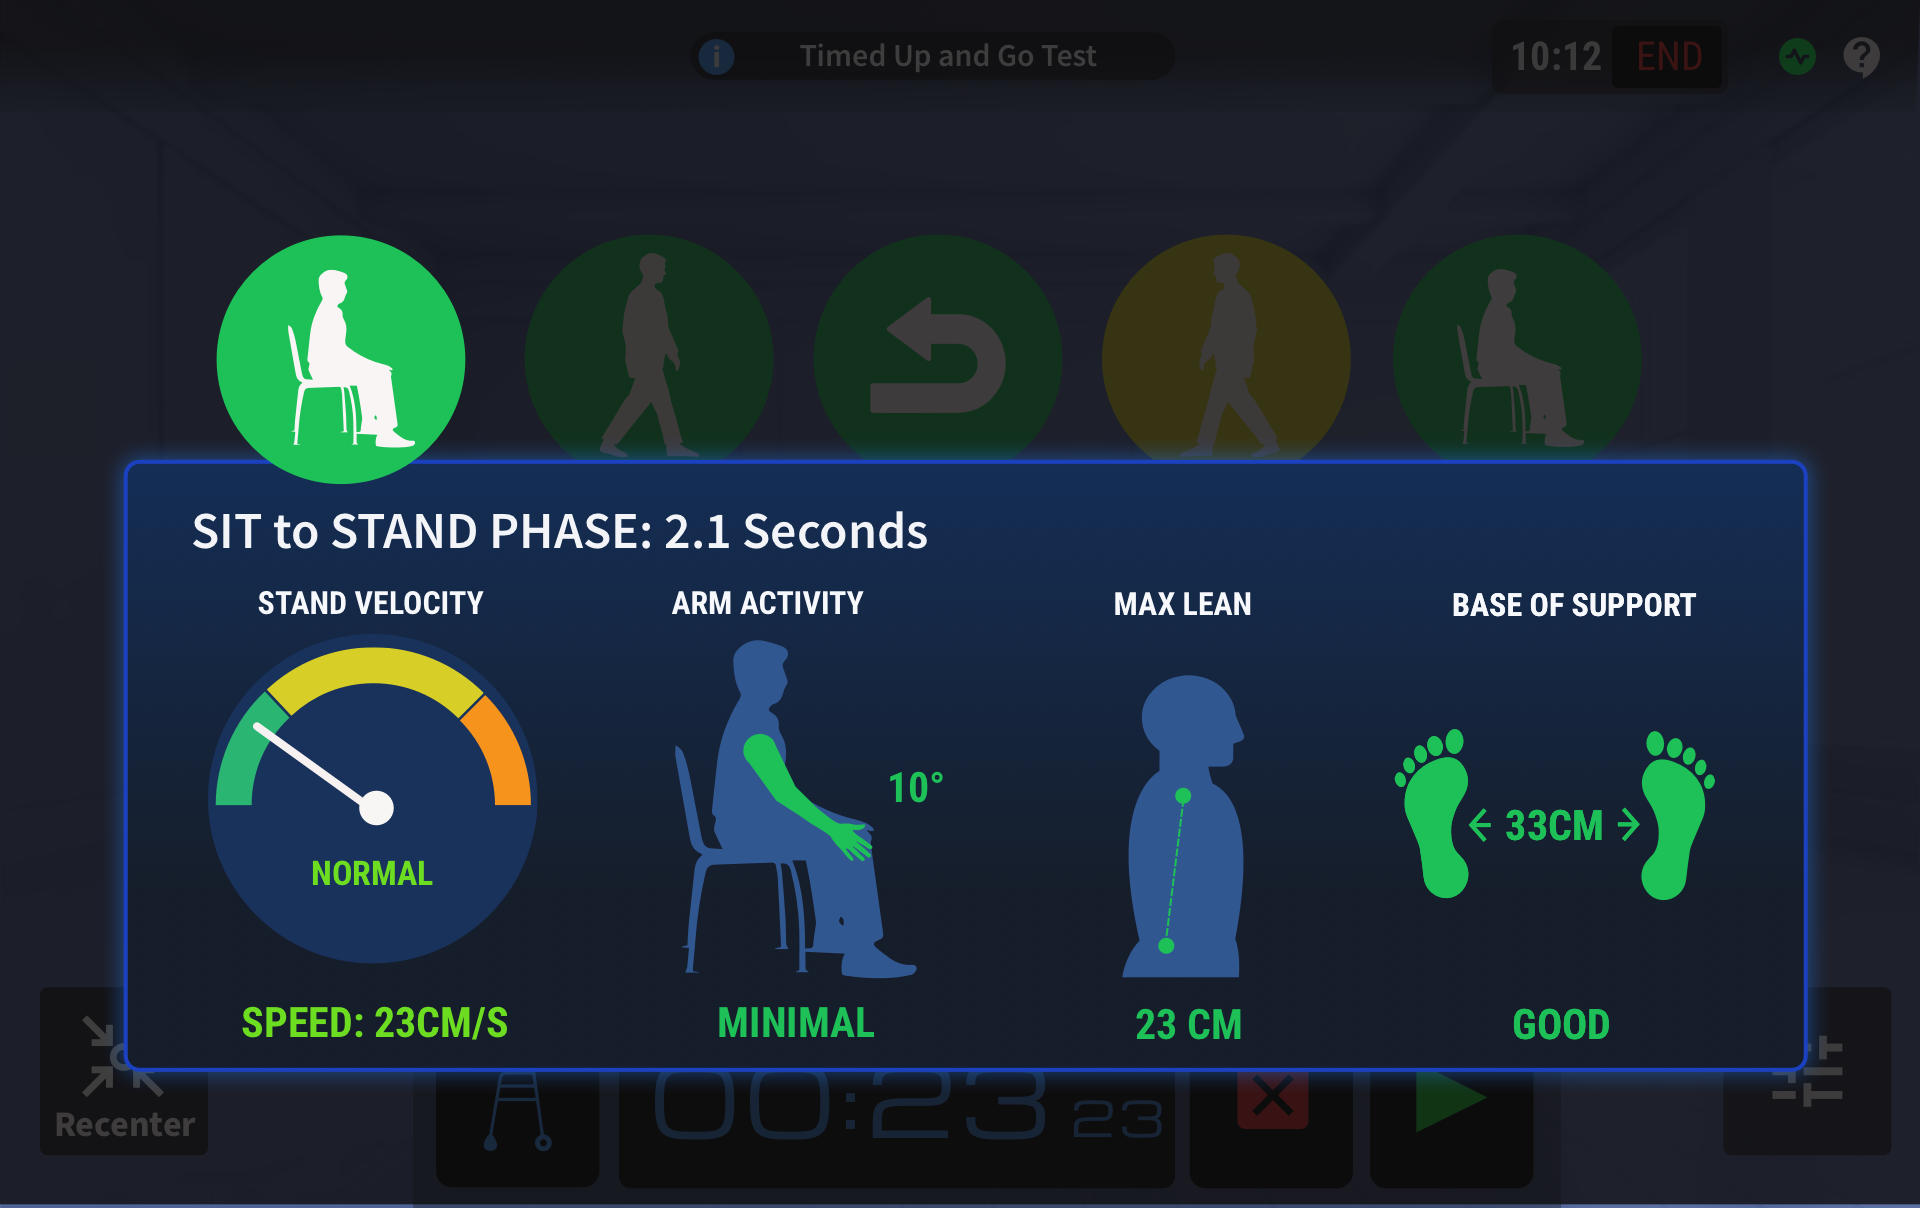
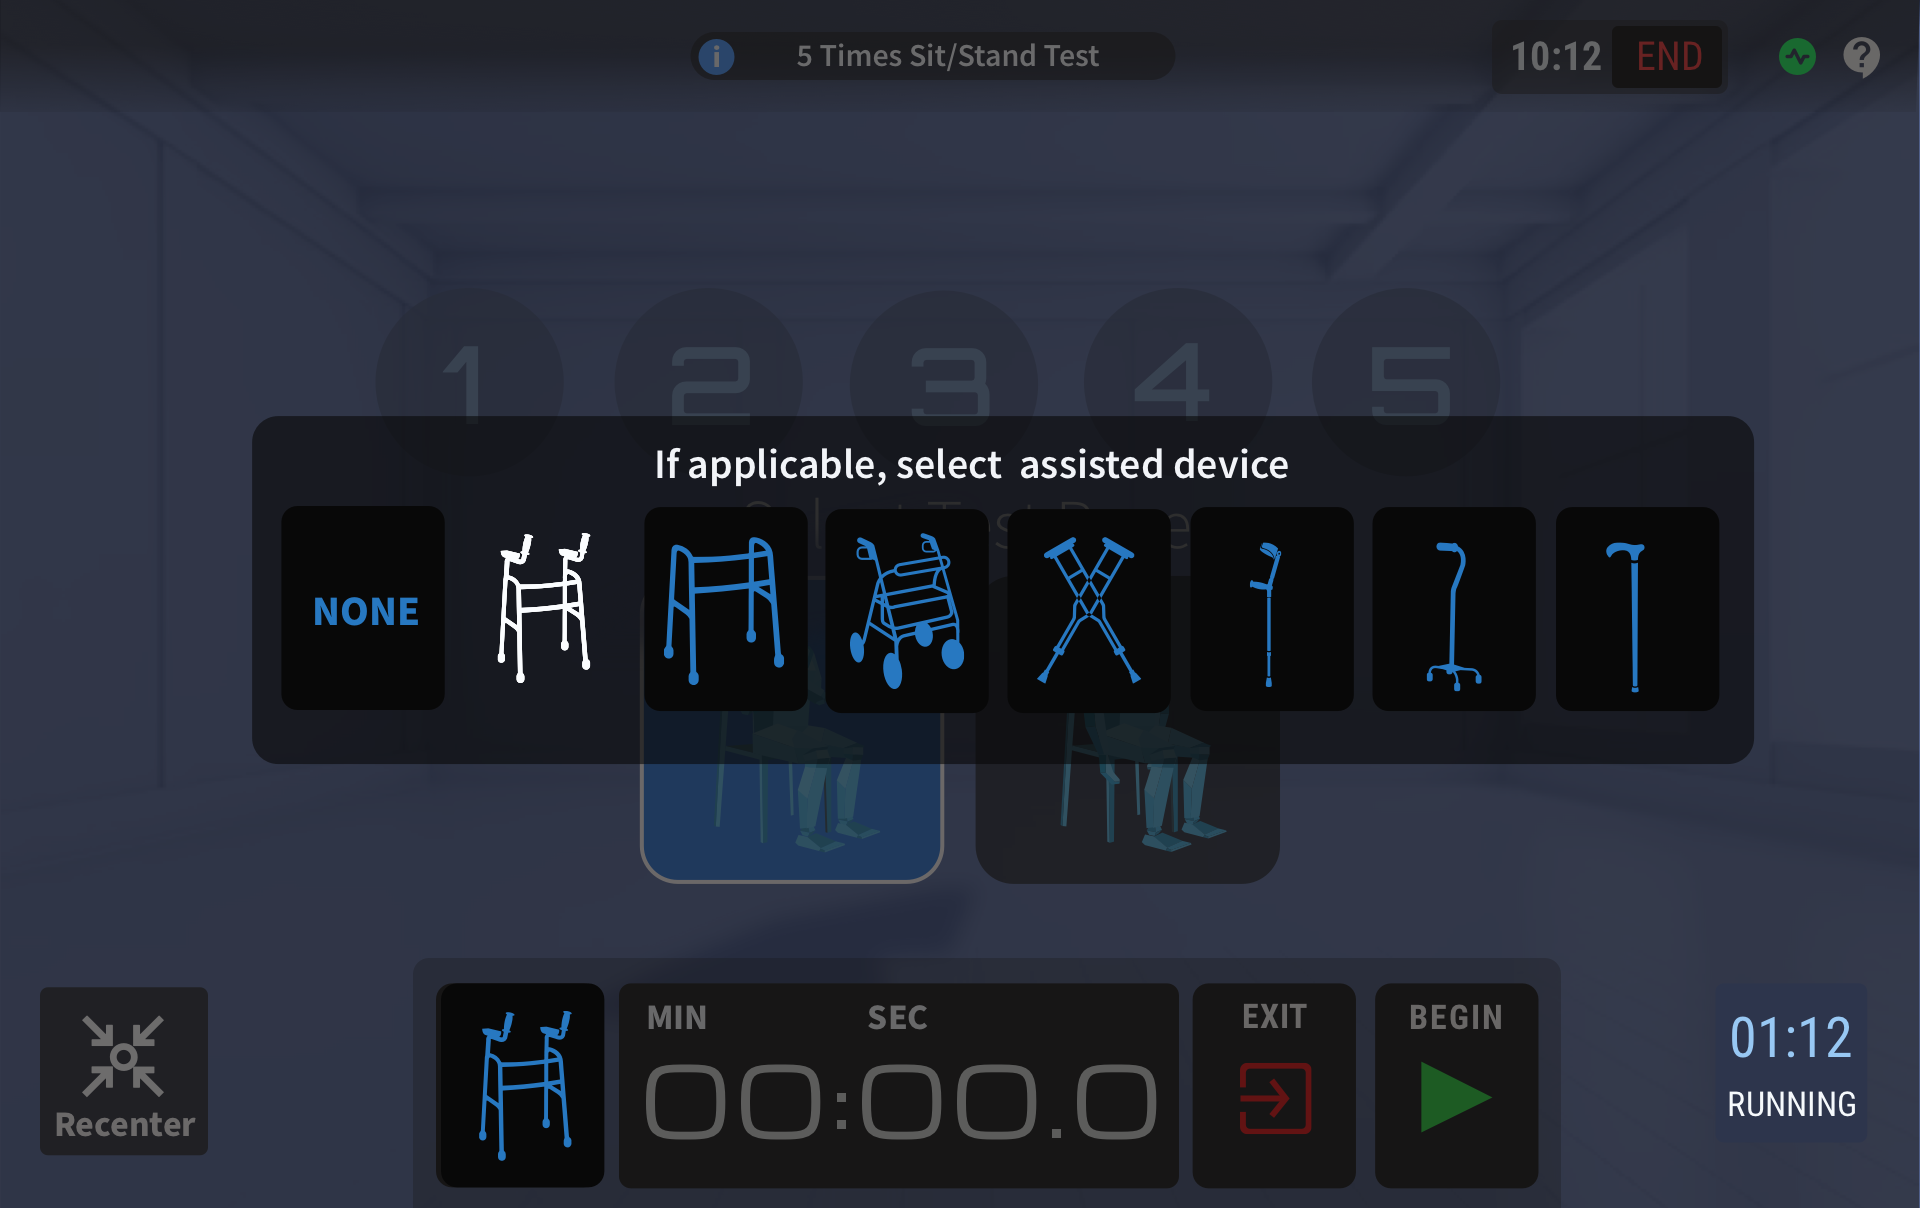
Assessment Applications
REAL System introduced a series of common therapy assessments into their catalog. Unlike other activities, assessments are scripted movements and can be comparative over time. Standing reach and static standing balance assessments can be conducted with the headset in place. Sensors can measure the accuracy to the cm and record progress over time. Static standing balance is similar but tests various feet poses for stability.
"SSB" tests the patient's ability to stay stable over a series of more difficult foot poses. Balance is a key indicator of a patient's vulnerability to accidents and fall risk. Single foot standing and staggered feet poses are the most difficult. REAL can track improvements over time.
Static standing balance tests can be completed numerous times in a session. This prototype design could show the complexities of overall tests, each test result and each phase result in a single infographic.
Most cognition tests are limited to mundane pen and paper tests. They are also not flexible and inaccurate indicators of cognition if the patient suffers from non-cognitive vision issues. VR is more flexible and therapists can adjust common tests, such as the Bells Test, to sort out true cognitive deficiencies from physical issues.
This test, which has 5 phases:
-Sit to Stand
-Walk 3 meters
-Turn around
-Return to Chair
-Stand to Sit
Can be conducted with the headset off and only using sensors
Each phase of the TUG test can be measured. Design is progressive disclosure and presented on demand. In the case of Sitting to Standing Phase, velocity and base of support can be tracked.
Another common assessment of relative strength and balance is the 5x Sit to Stand. REAL can measure time and verify completion with other sensor data to show areas of neglect or imbalance.
Adhering to the concept of the "5 foot display UI" Therapists can assist patients who are imbalanced and still see, at a glance, test adherence and completion metrics.
At any time, each test can use a physical assistive device. Each test is annotated with a device type and the longitudinal charts can show improvements per device or improvements using less extreme assistive devices over a period of sessions.
Information architecture for this test is complex but the results UI can operate as a good indicator of endurance and ability as the tests are conducted over a session.
The BERG Assessment is a 14 stage assessment and considered the gold standard in measuring fall risk. Due to it's length of time and complexity, therapists often forget the test phases or lose their place. The BERG can be conducted without the headset and uses sensors to track metrics and durations.
Therapists can annotate each phase of the 14 step test with a therapist assistance rating. This is placed on the phase result in each test.